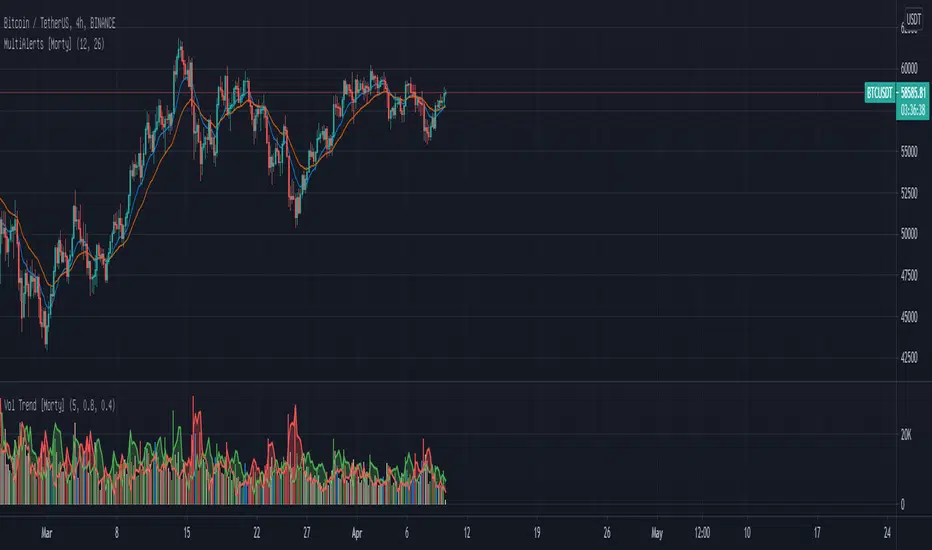
WTT Volume Trend [Morty]WTT Volume Trend by Morty
Inspired by Natural Trading Theory
It is a colored volume indicator based on the strength of single candlestick pattern.
It also paints two weighted volume SMA, which shows the strength and trend of the market.
Version 1.0, Updated at 20210327
Features:
- Colored volume bars (Optional)
- Weighted Bullish volume SMA trend lines according to candlestick pattern
- Weighted Bearish volume SMA trend lines according to candlestick pattern
- Adjustable volume SMA length
- Adjustable weighting factors
- Filling the background between volume SMA trend lines
Search in scripts for "VOLUME BAR"
Volume Color By Moving Average - RSJThis simple indicator paints with a darker color on the volume bar when the quantity traded is above the average of 20 periods of the volume itself, highlighting the moments when there was a large volume of deals above the average.
-----------------------------------------------------------------------------------------------------------
Este simples indicador pinta de uma cor mais escura a barra do volume quando a quantidade negociada no candle fica acima a média de 20 períodos do próprio volume, apresentando desta forma os momentos aonde houve um grande volume de negociações acima da média.

Volume Brakeout v1Volume Brakout indicator is used to help determine trend direction strictly based on Negative and Positive volume data.
How to Read:
- Moving Average crossovers are used to help determine a possible trend change or retracement.
- The area cloud on the bottom is calculated by the difference of the moving averages. This could be used to help determine the trending volume strength.
- Bright colored volume bars are large volume spikes calculated by the x factor in the options.
Other changes:
- Volume Depth is going open source with numerous of its indicators. This is only one of many!
- Volume is now displayed without being altered for calculations.

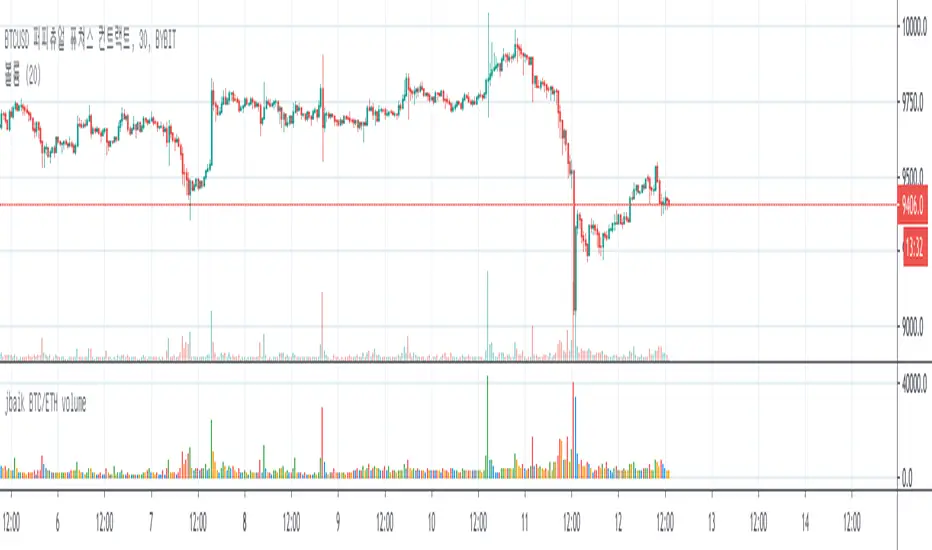
jbaik BTC/ETH volumeShows total BTC/ETH volume of different exchanges (non future)
Platform included :
COINBASE, POLONIEX, BITSTAMP , BITFLYER, KARAKEN, BINANCE, GEMINI , BITHUMB, HUOI, OKEX
Can turn on/off BTC or ETH volume on setting
Shows different colour per volume bar :
when price is higher and volume is higher than previous => green
when price is higher but volume is lower than previous => blue
when price is lower and volume is lower than previous => orange
when price is lower but volume is higher than previous => red
Volume Flow v3DepthHouse Volume Flow indicator is used to help determine trend direction strictly based on Negative and Positive volume data.
How to Read:
- Moving Average crossovers are used to help determine a possible trend change or retracement.
- The area cloud on the bottom is calculated by the difference of the moving averages. This could be used to help determine the trending volume strength.
- Bright colored volume bars are large volume spikes calculated by the x factor in the options.
Other changes:
- DepthHouse is going open source with numerous of its indicators. This is only one of many!
- Volume is now displayed without being altered for calculations.

DepthHouse Volume Flow Indicator v2The DepthHouse Volume Flow Indicator is used to help determine trend direction, and possible reverals with calculations strictly based off of volume data.
A crossover of the moving averages is a possible signal for a trend change or retracement.
Trendlines may be drawn on the histogram, and moving averages to help spot possible breakouts, and/or divergences even sooner.
Be sure to check out all of my other indicators!
Changes from version 1:
Completely altered based calculation of moving averages.
Removed the standard volume bar option and the volume overflow option.
Replaced the options above with the histogram volume bars.
Since this update completely altered the way the original worked, I have posted this as an entirely new script.
Original Indicator:

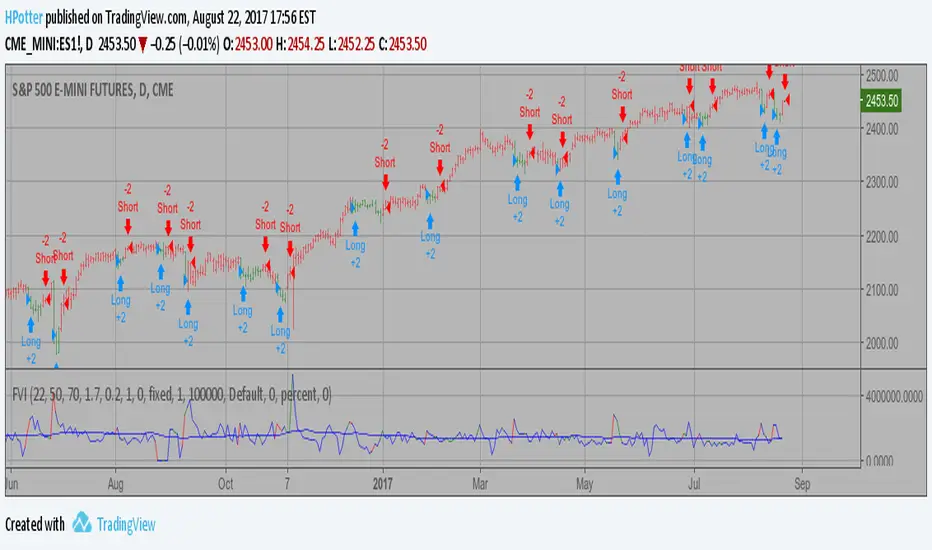
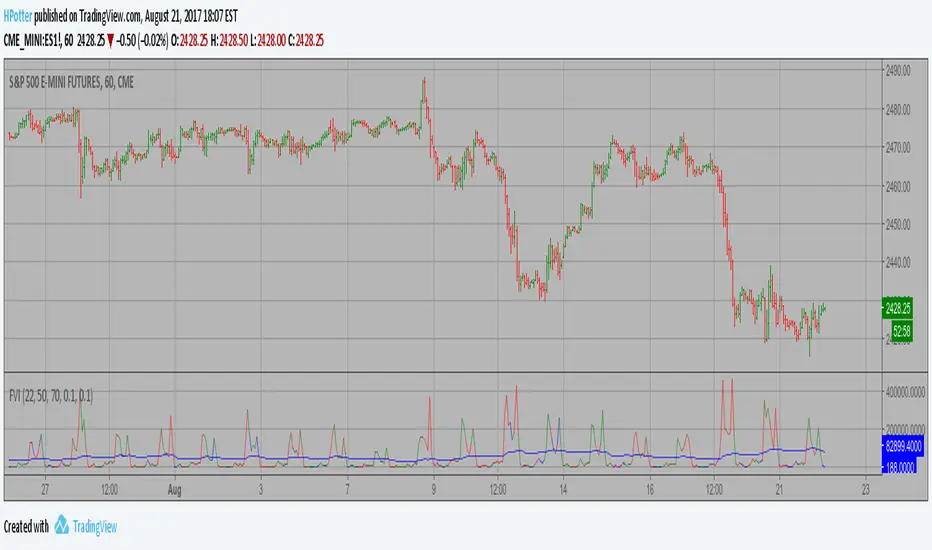
Volatility Finite Volume Elements Strategy The FVE is a pure volume indicator. Unlike most of the other indicators
(except OBV), price change doesn?t come into the equation for the FVE
(price is not multiplied by volume), but is only used to determine whether
money is flowing in or out of the stock. This is contrary to the current trend
in the design of modern money flow indicators. The author decided against a
price-volume indicator for the following reasons:
- A pure volume indicator has more power to contradict.
- The number of buyers or sellers (which is assessed by volume) will be the same,
regardless of the price fluctuation.
- Price-volume indicators tend to spike excessively at breakouts or breakdowns.
This study is an addition to FVE indicator. Indicator plots different-coloured volume
bars depending on volatility.
You can change long to short in the Input Settings
Please, use it only for learning or paper trading. Do not
Volatility Finite Volume Elements Strategy The FVE is a pure volume indicator. Unlike most of the other indicators
(except OBV), price change doesn?t come into the equation for the FVE
(price is not multiplied by volume), but is only used to determine whether
money is flowing in or out of the stock. This is contrary to the current trend
in the design of modern money flow indicators. The author decided against a
price-volume indicator for the following reasons:
- A pure volume indicator has more power to contradict.
- The number of buyers or sellers (which is assessed by volume) will be the same,
regardless of the price fluctuation.
- Price-volume indicators tend to spike excessively at breakouts or breakdowns.
This study is an addition to FVE indicator. Indicator plots different-coloured volume
bars depending on volatility.
Volume-Price Divergence Indicator V3Description:
This indicator helps you identify volume-price divergences and potential trend weakness across any specified timeframe.
Features:
Volume bars with moving average – green for bullish, red for bearish, with orange SMA to detect low-volume situations.
Custom OBV calculation with divergence detection – highlights when price makes new highs/lows but OBV does not.
VWAP deviation alerts – signals when price moves far from VWAP while volume remains low, indicating potential fake breakouts.
Fully configurable – select any reference timeframe, adjust volume MA, OBV period, and VWAP deviation threshold.
Visual markers – easily spot bullish/bearish divergences and volume-price mismatches directly on your chart.
Use case:
Spot early trend exhaustion points.
Identify fake breakouts or weak rallies/drops.
Combine with your existing trading strategy for more informed entries and exits.
Volume-Price Divergence Indicator V2Description:
This indicator helps you identify volume-price divergences and potential trend weakness across any specified timeframe.
Features:
Volume bars with moving average – green for bullish, red for bearish, with orange SMA to detect low-volume situations.
Custom OBV calculation with divergence detection – highlights when price makes new highs/lows but OBV does not.
VWAP deviation alerts – signals when price moves far from VWAP while volume remains low, indicating potential fake breakouts.
Fully configurable – select any reference timeframe, adjust volume MA, OBV period, and VWAP deviation threshold.
Visual markers – easily spot bullish/bearish divergences and volume-price mismatches directly on your chart.
Use case:
Spot early trend exhaustion points.
Identify fake breakouts or weak rallies/drops.
Combine with your existing trading strategy for more informed entries and exits.
Volume-Price Divergence Indicator (OBV + VWAP, Multi-Timeframe)Description:
This indicator helps you identify volume-price divergences and potential trend weakness across any specified timeframe.
Features:
Volume bars with moving average – green for bullish, red for bearish, with orange SMA to detect low-volume situations.
Custom OBV calculation with divergence detection – highlights when price makes new highs/lows but OBV does not.
VWAP deviation alerts – signals when price moves far from VWAP while volume remains low, indicating potential fake breakouts.
Fully configurable – select any reference timeframe, adjust volume MA, OBV period, and VWAP deviation threshold.
Visual markers – easily spot bullish/bearish divergences and volume-price mismatches directly on your chart.
Use case:
Spot early trend exhaustion points.
Identify fake breakouts or weak rallies/drops.
Combine with your existing trading strategy for more informed entries and exits.
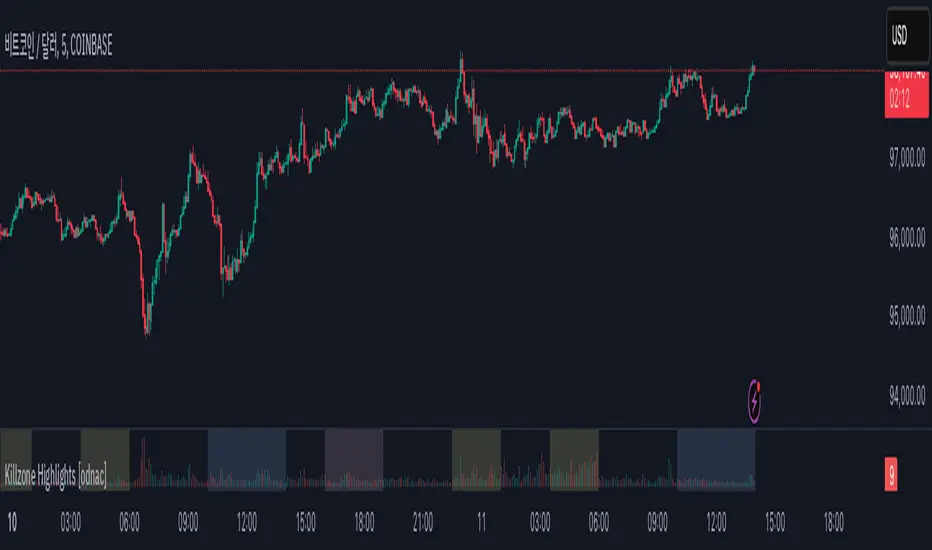
Killzone Highlights with Volume [odnac]
Description:
This indicator seamlessly integrates volume analysis with kill zone highlights across different market sessions.
The indicator dynamically displays trading volume and visually emphasizes key trading sessions in various time zones, including Asia, Europe, and New York (both AM and PM sessions).
Users have the flexibility to customize the colors of bullish and bearish volume bars, as well as the transparency and color of the kill zone highlights, allowing for tailored visual analysis of trading periods.
Features:
Bullish and Bearish Volume Colors:
Displays the volume of trades with user-defined colors for bullish (up) and bearish (down) candles.
Killzone Highlights:
Highlights the kill zones for Asia, Europe, New York AM, and New York PM sessions with user-defined colors and transparency.
Customization Options:
Allows users to adjust the colors, transparency, and time settings for each kill zone.
Weekend Handling:
Option to hide kill zone highlights during weekends.
Timeframe Limitation:
Users can set the maximum timeframe for which the kill zone highlights will be displayed.
Usage:
This indicator is designed for traders who want to gain insights into market activity during key trading sessions.
By combining volume data with visually distinct kill zone highlights, it helps traders make informed decisions based on the most active trading periods.
Ideal for intraday traders looking to leverage session-based strategies for more effective trading decisions.
Buy/Sell Volume confirmation for BO_Entry_ExitThis script helps to identify the volume strength basis EMA and various EMA multipliers, There are provisions provided to enable and disable when the volume is gaining momentum and the volume for a particular candle touches the Break Out criteria. Users will be able to modify the criteria for Volume strength and Volume break out Indication. It will also show the buyers & sellers strength of a volume bar which the uses will be able to enable and disable.
Uniform Volume ProfileUniform Volume Profile
The volume of a single candlestick is uniformly distributed by its range (high - low) along all the colliding volume profile bars.
For example, if a 10% of a candlestick intersects some volume bar (horizontal line) only the 10% of that candlestick volume will contribute to that profile.

RogTrader Bull Bear StrengthsSimplified Bull/Bear Strengths Indicator uses price action, volume flow, and candlesticks to calculate bull and bear strengths, also known as buying and selling pressures.
Green/Red Volume Bars can be misleading at times
This indicator shows the net bull/bear power
Recommended to be used in combination with indicators to find reversal signals.
For example, during an uptrend, a long red bar indicates that strong selloff has started, and bears begin to control the bargains.

ChaosVChaosV- Chaos Volume, is another Bill Williams' style indicator. It's essentially the Profitunity Candles, but in a Volume Bar setup. It incorporates MFI, to determine if a bar meets the Green, Squat, Fade or Fake requirements, as set by Bill Williams in his book Trading Chaos.

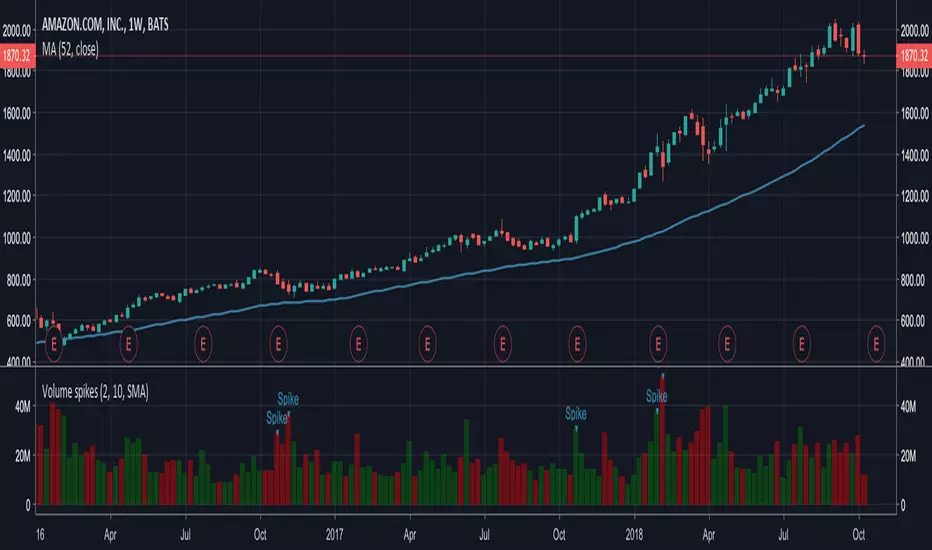
Volume spikesSimple indicator which shows volume spikes.
By default spike is defined as such when volume is 2 times higher than average volume for last 10 volume bars (this can be changed in settings)
Also instead of using average volume (SMA is used in this case) you can use WMA or EMA by changing settings
Hullfib-trailingso I add a trialing function based on volume pf the bars
this will ,ake the system more easy for the trader
1. Hull mean avreage with color changes (green -red that show the trend )
2. signal prouduce by Hull and bollinger fibs
3.signal prouduce by trailing volume bars (B , S)
4. upper and lower daily fibs
togetther you can make good combination when you bet on bitmex
have fun


EdgeAnalysisGroup: Volume BarsVolume painted bars to show primary trends and short-term floats during low volume.

Maple Liquidity Hunter📌 Description for Maple Liquidity Hunter
Maple Liquidity Hunter – AI-Enhanced Volume Liquidity Detector
Maple Liquidity Hunter is an advanced volume-based indicator designed to uncover hidden liquidity zones in the market.
By dynamically analyzing price–volume interactions, it automatically highlights momentum shifts with adaptive color coding.
✨ Key Features
AI-inspired volume/price analysis model
Detects liquidity surges and potential absorption points
Auto-coloring of volume bars for quick visual recognition
Optional volume moving average filter for trend context
⚠️ Disclaimer: This tool is for educational and research purposes only. It does not guarantee future results. Always test thoroughly before live trading.

VP-Period with Previous Day Levels & Historical POC# Volume Profile with Previous Day Levels & Historical POCs
## Description
Comprehensive indicator combining Volume Profile analysis, previous day levels, and historical POC (Point of Control) levels for advanced technical analysis.
## Key Features
### Volume Profile
- **Customizable period**: 3 to 500 days
- **Calculation resolution**: 400 to 700 points
- **Current VPOC**: Point of Control line for current period
- **Volume bars**: graphical display of volume profile distribution
### Historical POCs
- **POC history**: up to 20 previous days
- **Time labels**: shows how many days ago for each POC
- **Dashed lines**: easy identification of historical levels
### Previous Day Levels (last 5 days)
- **High/Low**: daily highs and lows
- **Midpoint**: 50% level (High+Low)/2
- **Open/Close**: opening and closing prices
- **Progressive thickness**: day 1 thicker, decreasing for previous days
## Customization
- Fully configurable colors for each element
- Toggle on/off switches for every component
- Different line styles (solid, dashed, dotted)
## Usage
Perfect for traders using volume analysis and support/resistance based on previous daily levels. Ideal for identifying key zones and significant breakout points.
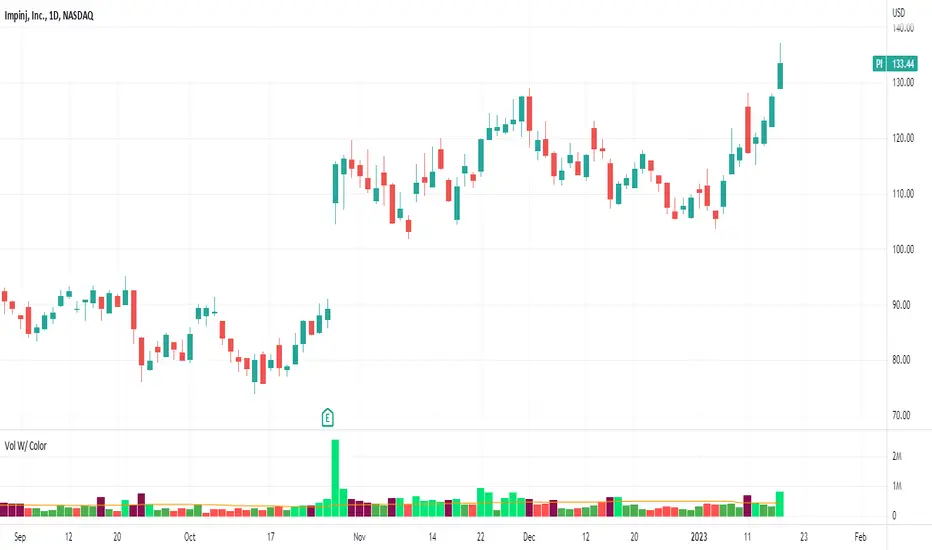
Volume With ColorVolume with color helps to quickly identify accumulation or distribution.
An accumulation day is an up day with volume greater than a user selected average.
A distribution day is a down day with volume greater than a user selected average.
This indicator will highlight those days by changing the volume bar colors for an easy visual.